
James Strachan | Data Visualisation | #MakeoverMonday | 2020 | Week 41
Introduction
This week was a much smaller data set (thank goodness!) Just 16 part-to-whole % values detailing the breakdown of a 103-strong online survey sample from dataIQ about Data Assets & Data Culture. Here's a link to their report if you're interested. What you're about to see it surprisingly bad given it was produced by a professional data analytics industry body!
The DataIQ Original
The report is littered with examples of bad data visualisations, which are graphically eye-catching, but very difficult to read and understand. However, the example chosen for this week was the particularly bad curved bar chart, which not only distorted the %'s visually (e.g. retail is only 13% but looks visually like almost 100%), but also hadn't even been sorted, which didn't help!

Polar Opposites
It seemed to me that analyst responses to this challenge fell into one of two camps: i) they either tried to re-create the chart as shown (and perhaps fix it); or ii) they stuck rigidly to data visualisation best practice and simply used a neatly sorted bar chart (which is objectively the best solution). I do understand the motivations of the first group though, as custom-charts can look sexy and cool and 'wow' audiences! I'd like to learn some of these techniques at some point, but in all honestly it is extremely rare that they ever get used in a professional, business context. In any case, here's the best example I saw of the straight fix in the style of the original by OG Green:

Units of Measurement
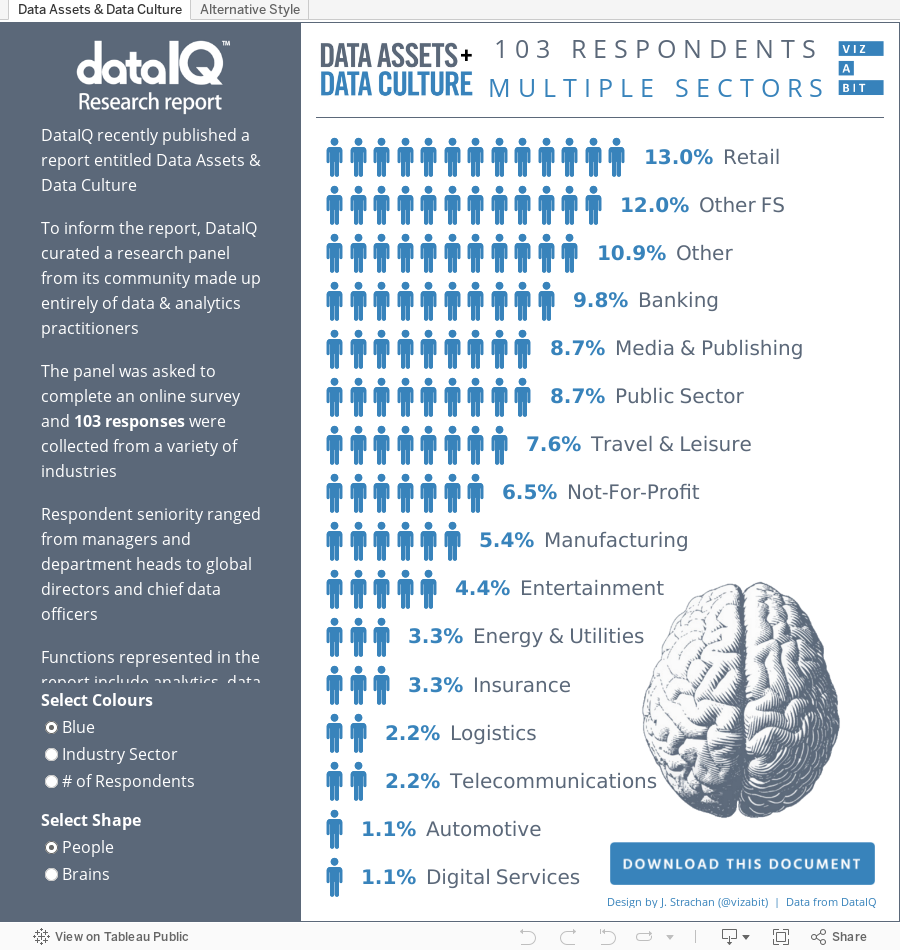
For my own design, I decided to choose something between the two extremes - not quite a bar chart, but not quite an infographic - called a 'unit chart' This is where icons are used to depict units (in this case little people for respondents) and stacked together to give the impression of a bar. With larger data sets you would need to scale the values represented by the icon (e.g. one little person represents 100 people in the data), but in the case of this set, as there were only 103 respondents, one little person almost (but not quite) represents one real person. This was my first time creating a chart like this. It is very simple, but I nevertheless found this YouTube tutorial from Jenny Martin at the Information Lab's Data School to be quick and easy to follow!
My #Vizabit Redesign
So here's what my final redesign looks like on desktop (I created two variants - a second one with little people inside rounded bars, which is less clean from a design aesthetic, but I was so impressed I'd managed to get them in there I didn't want to delete that version, so I kept both):

And here's what both variants look like on mobile:

And here's a GIF of the (very limited) interactivity (just because I like GIF's):

Try it for yourself...
The version you see will depend on the device you are using
Thanks Aaron - I'm glad you found it helpful
ReplyDelete