James Strachan | Data Visualisation | #MakeoverMonday | 2021 | Week 10
Introduction
Female participation in the Olympics has increased significantly over the last century and this week's #MakeoverMonday focussed on this increasing trend.
The International Olympic Committee (IOC) Original
There isn't much wrong with the IOC chart in all honesty. The trend is very clear, and I like the obvious breaks when there was no Olympic games during Word War I and World War II. Rounding the % to zero decimal places on the y-axis; providing more granularity on years on the x-axis; labelling the end of the line; and perhaps softening or removing the grid lines altogether would provide a little more polish.

My #Vizabit Redesign
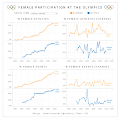
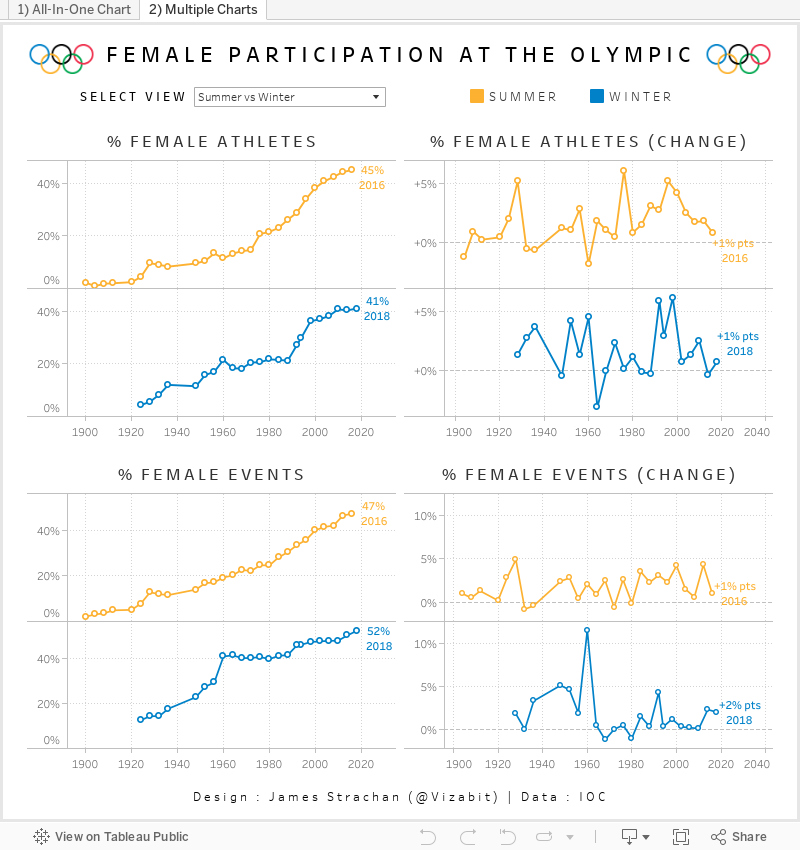
As the original viz was so clear, I was lacking in inspiration this week in terms of how to improve it. In the end I settled for a clean, simple, hopefully professional looking mini-dashboard with a few more views looking at the growth in the # of female Olympic events over time, and the period-on-period change in both metrics. I used a white background (for once) and produced an 'all-in-one' chart with a parameter to switch metrics, as well as a second dashboard view showing all 4 charts side-by-side (as I couldn't decide which one I preferred). As usual, I also spent some time formatting for mobile, which is still a bit fiddly, as things often don't display on Tableau Public in quite the same way as they do on Tableau Desktop. Below is an image of the multi-chart desktop view...

Comments
Post a Comment